These words show up in almost every system design discussion:
- Scalability
- Performance
- Latency
- Throughput
When I first started building systems, I treated them all as synonyms for "fast."
They are related, but they are absolutely not the same thing. If your mental model is fuzzy here, everything that comes later (caching, databases, message queues, microservices) becomes much harder to reason about.
The One-Sentence Mental Model
Performance is how well your system behaves right now, while Scalability is how well it continues to behave as the load grows.
Latency and throughput are simply the two most important rulers we use to measure that behavior.
The Four Terms (And How They Differ)
Before we look at how they interact, let's lock down what they actually mean.
1. Latency (The Waiting Game)
Latency is the time it takes for one specific operation to complete from start to finish.
- Examples: "This API call took 85 ms." or "The page became interactive in 1.4 seconds."
- Goal: Lower is better.
2. Throughput (The Workhorse)
Throughput is the total volume of work your system finishes in a given period of time.
- Examples: 2,000 requests/second, 50,000 messages/minute, or 300 database writes/second.
- Goal: Higher is better.
3. Performance (The Overall Picture)
Performance is a broad, subjective term. It is the overall observed speed and efficiency of the system, usually described by combining latency percentiles, throughput, error rates, and resource usage (CPU/Memory).
4. Scalability (The Growth Curve)
Scalability isn't a speed; it's a trajectory. A scalable system can handle increased traffic or data volume predictably—meaning costs rise linearly (not exponentially) and performance doesn't suddenly fall off a cliff.
The Cheat Sheet Table
| Term | What it answers | The Restaurant Analogy | Unit of Measurement |
|---|---|---|---|
| Latency | "How fast is my request?" | How long one customer waits for their food. | Milliseconds (ms), Seconds (s) |
| Throughput | "How much work are we doing?" | How many customers the kitchen feeds per hour. | Requests per second (RPS) |
| Performance | "Is the system healthy?" | Are customers happy, and is the kitchen efficient? | (A mix of Latency, Throughput, Errors) |
| Scalability | "What happens when we grow?" | Can we smoothly add more cooks to handle a dinner rush? | Cost vs. Load curves |
Why p95 and p99 Matter More Than "Average"
In system design, people throw around "p95" and "p99" so often that it becomes invisible jargon. The "p" simply stands for percentile.
Instead of looking at the average speed of your system, percentiles organize all your requests from the fastest to the slowest to show you what users are actually experiencing.
- p50 (The Median): If your p50 latency is 50ms, it means 50% of your requests are faster than 50ms, and 50% are slower. Think of this as the "typical" experience.
- p95: If your p95 latency is 200ms, it means 95% of your requests are faster, but 5% are slower. This represents the "frustrated minority."
- p99 (The Tail): If your p99 latency is 1.5 seconds, it means 99% of your requests are faster, but 1% are slower. This is often called "tail latency," representing the absolute worst experience your system is actively handing out.
The "Average" is a Trap
Imagine you have a small API that processes 100 requests. 99 of those requests are lightning-fast (10ms each). But 1 request gets stuck waiting on a database lock and takes 5,000ms (5 seconds).
If you look at the average latency on your dashboard, it will show ~60ms. You might look at that and say, "60ms! The system is incredibly fast! Ship it."
But if you look at the percentiles:
- p50: 10ms
- p95: 10ms
- p99: 5,000ms
The percentiles reveal the truth that the average hid: the system is mostly fast, but occasionally it stalls completely and gives someone a terrible experience.
Amplification: Why We Obsess Over the 1%
You might think, "Who cares about 1% of users? 99% are happy!"
In modern system design, you care about the p99 because of amplification. Imagine a user loads your homepage, and that homepage has to make 100 different microservice calls behind the scenes to fetch their profile, their cart, recommendations, ads, etc.
If your backend services have a 1% chance of being slow (a bad p99), the odds of that user hitting at least one slow request out of 100 is over 63%.
Where does this 63% came from?
That is the math of tail latency amplification, and it is one of the most brutal realities of distributed systems.
Here is exactly how that calculation works.
Instead of trying to calculate the odds of 1, 2, 3, or 100 requests being slow, it is mathematically much easier to calculate the exact opposite: What are the odds that every single request is perfectly fast?
- The single request: If your p99 is bad, that means 1% of requests are slow. Therefore, the chance of any single request being fast is 99%, or .
- The multiplier: To load a page that requires 100 backend calls, request #1 must be fast, and request #2 must be fast, and request #3 must be fast... all the way to 100.
- The equation: In probability, "and" means you multiply. So you multiply by itself 100 times:
- The result: There is only a chance that all 100 requests complete quickly.
To find the odds of a slow page load (meaning at least one request was slow), you just subtract that number from 1 (or 100%):
So, even if an individual microservice is bragging about being fast "99% of the time," any user loading a complex page that hits that service 100 times has a roughly chance of feeling the pain of that 1% tail latency.
This is why companies like Amazon and Google write entire whitepapers on managing tail latency. When you build microservices, the p99 of a single service quickly becomes the median experience of your entire user base.
Because a web page is only as fast as its slowest required piece, a bad p99 on the backend means that the majority of your actual users will experience a slow page load.
In production, these slow "tail" requests often come from:
- Lock contention in the database.
- Noisy neighbors on shared cloud hardware.
- Cache misses requiring origin fetches.
- Garbage Collection (GC) pauses in your runtime.
Rule of Thumb: When someone says "performance is good," immediately ask: "At which percentile?"
Capacity and Saturation (The Hidden Turning Point)
This is the most important concept in system dynamics. Every component has a hard limit: CPU saturates, connection pools fill up, and network bandwidth maxes out.
Here is the trap: Before saturation, latency grows very slowly. But the moment you hit saturation, throughput stops growing, and latency skyrockets. This "hockey stick" cliff is exactly why a system that "worked perfectly in staging" can completely melt down in production.
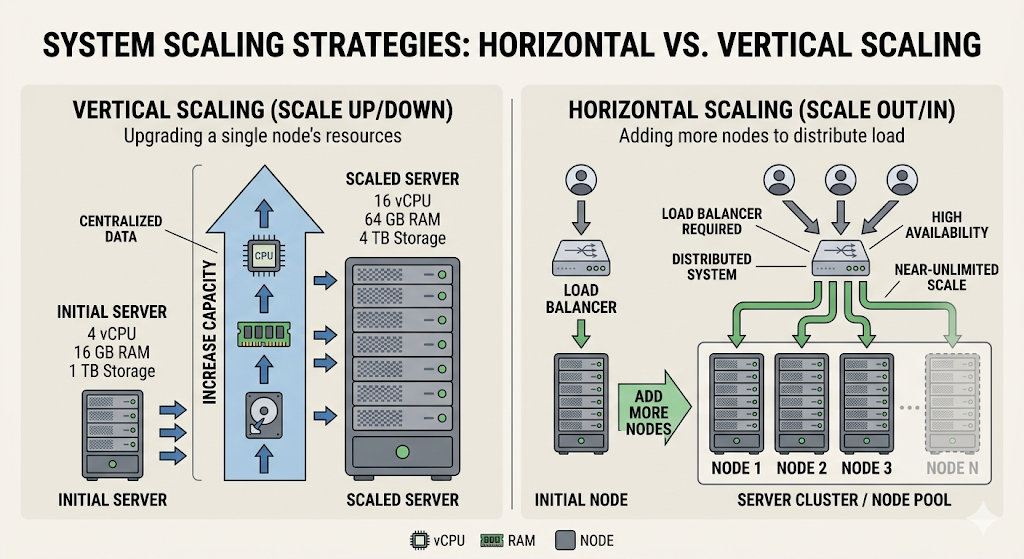
Vertical vs. Horizontal Scaling
When you finally hit that saturation point, you have two choices.
1. Vertical Scaling (Scale Up)
Buy a bigger box. Give one machine more CPU, more RAM, or a faster disk.
- Pros: Operationally simple. No code changes.
- Cons: Hard hardware limits. Extremely expensive at the top end. If that one machine dies, you are down.
2. Horizontal Scaling (Scale Out)
Add more machines and distribute the load.
- Pros: Virtually infinite growth ceiling. Great for high availability.
- Cons: Massively increases architectural complexity. You now have to deal with load balancers, network partitions, data consistency, and distributed logging.
Most successful systems start vertical and are forced to go horizontal as they grow.
Scalability Is Not Free (The Bottleneck Shift)
A common beginner mistake is assuming: "If we just add servers, problem solved."
In reality, some bottlenecks do not scale linearly:
- A single write-primary database.
- Shared global locks.
- Sequential workflows.
If 10 web servers are all waiting on a single locked database row, adding 40 more web servers won't increase throughput—it will just increase the number of servers waiting in line. You usually need architecture changes, not just more instances.
The Core Trade-off Triangle
In system design, you are constantly balancing Latency, Throughput, and Cost/Complexity. You can usually improve one, but it will cost you another.
- Aggressive caching: Lowers latency and DB load (good), but risks serving stale data (complexity).
- Batch processing: Massively improves throughput (good), but increases the latency for any individual item in the batch (bad).
- Strong database consistency: Ensures perfect data correctness (good), but increases latency because nodes must talk to each other before responding (bad).
Design is mostly trade-off management, not perfect optimization.
The Gotchas I’d Warn My Past Self About
- "Fast on localhost" means almost nothing. Your laptop doesn't have network jitter, noisy neighbors, or 10,000 concurrent connections.
- 10x traffic does not mean 10x hardware. As load grows, your bottlenecks will move. First the CPU maxes out, then the DB connection pool, then the network bandwidth.
- Optimizing only average latency is a trap. It creates systems that look good on Datadog but feel terrible for actual users.
- Premature microservices will kill your latency. Splitting a monolith too early introduces network hops and serialization overhead.
- Missing backpressure causes cascading failures. If a database is slow, and the web servers don't stop accepting requests, the web servers will run out of memory holding open connections and crash too.
A Simple Growth Playbook (What to do first)
When traffic grows, don't instantly jump to sharded databases. Follow the sequence:
- Measure: You can't fix what you can't see (RPS, p99 Latency, Errors, CPU).
- Clean up: Remove obvious waste (N+1 queries, missing DB indexes, oversized JSON payloads).
- Cache: Add caching where read-heavy patterns justify it.
- Async: Introduce message queues for non-critical work (like sending emails).
- Scale Out: Put stateless web services behind a load balancer.
- Data Layer: Finally, look at read replicas or sharding when the DB actually melts.
A high-performance system can still be impossible to scale, and a scalable architecture can still feel slow to users. You need both.